Theory of Change

All students deserve challenging and supportive daily instruction that will help them reach their full potential.
Students have big dreams for their lives and are largely doing what is asked of them in school. 94% of students aspire to go to college. 88% of the time, K-12 students are working on activities related to class. 71% of the time, students meet the expectations of their assignments. And, 80% of students earn As, Bs, or Cs in ELA and math.*
Although students are completing their work and receiving grades that indicate they are on track for success, many graduate unprepared for post-secondary education and career opportunities. Nationwide, just 35% of students are proficient or above in reading, and 41% are in math. 70% of high school graduates go on to post-secondary education, but 40% take at least one remedial course, which makes them 74% more likely to drop out.**
The everyday instruction students experience in school explains the gap between student effort and student results. In one school year, the average student spends 530 of 720 school hours in core classes on assignments that are not grade-appropriate.^ Too often, students are not getting the opportunity to learn the content that they need in order to develop grade-level proficiency in preparation for college and careers.
Furthermore, there are clear inequities in the instructional experience of students. Students of color, students in poverty, students learning English, and students with disabilities are particularly shortchanged in their daily instruction—more often experiencing significantly lowered expectations and inequitable access to strong instruction. “The Opportunity Myth” study found that one-third of students of color never received assignments that were on grade level, and classrooms with mostly high-income students had five times more high-quality lessons than classrooms with mostly low-income students.
Educators are working hard and eager to learn.
Leaders and teachers are working hard and are eager to do whatever they can to improve instruction. However, principals report feeling low levels of preparation quality for tasks focused on curriculum, instruction, and assessment during their formal training or preparation programs. This lack of instructional leadership in turn leaves teachers feeling unsupported in their roles. Teachers work on average 53 hours per week. While 93% of teachers say they welcome feedback from their school leaders, only 30% feel like they are given timely and useful feedback.^^
The drivers of student learning are known.
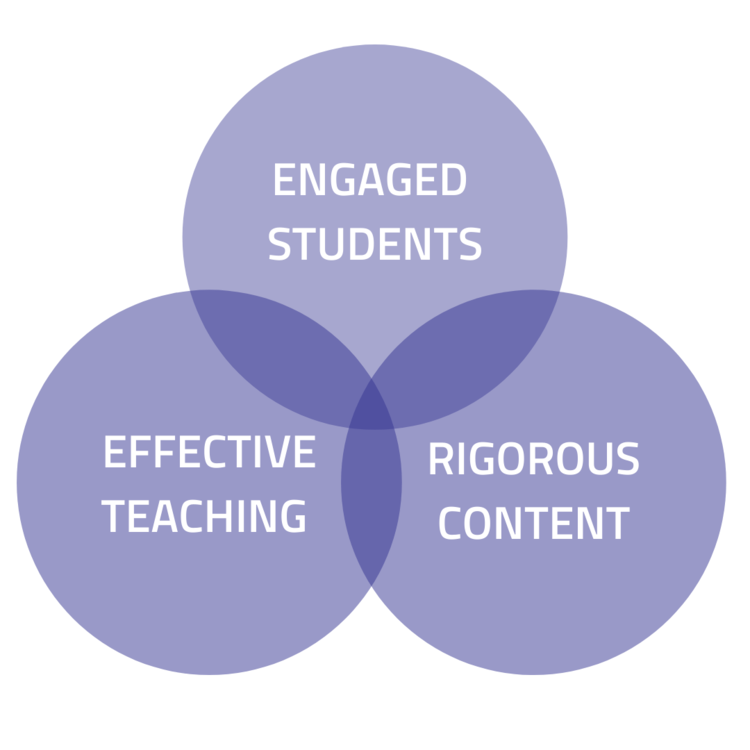
There are many factors, within and outside of a school system, that shape the education students experience. However, we know that within a classroom, there are essential instructional conditions that must be in place to improve student learning—effective teaching, engaged students, and rigorous content.
We build the capacity of system and school leaders to support effective, equitable instruction
Getin
touch